Great on Desktop, Lost on Phones: The 3D Configurator Mobile Gap
Your 3D configurator was probably approved on a large monitor, and that's rarely where buyers meet it. Wayfair's own Q4 2025 earnings release, a company-reported figure, puts 64.9% of its quarter's orders on mobile devices (Wayfair Q4 2025 results, 2026). For one of the biggest furniture retailers online, the phone is the main store, not a side entrance.
We score every live configurator in our catalog on ten criteria, and one of them is mobile: layout, touch controls, legible option panels and a 3D view that stays usable on a small screen. Catalog numbers here update live from the 140 apps we track, scored as explained in how we score interactive 3D apps.
The short answer
Mobile is the weakest of our ten sub-scores at the time of writing. It averages 3.55 out of 5 across the catalog, against 4.26 for stability, 4.09 for asset strategy and 3.59 for interactivity, the next-lowest. Of the five industries we cover in depth, home and garden (3.28) and fashion (3.48) trail the most, while watches and jewelry lead (4.00).
The configurators that close the gap compress geometry and textures, budget the first frame, show a preview image while 3D loads, and keep the product in view while buyers tap through options.
How do 3D configurator mobile scores compare by industry?
At the time of writing, home and garden configurators average 3.28 on mobile, the lowest of the five industries we cover in depth, with fashion next at 3.48. Watches and jewelry do best at 4.00, and furniture (3.66) sits above the catalog average. Setting mobile beside performance shows where fast builds still stumble on phones.
| Industry | Apps tracked | Performance average | Mobile average | Below 3 on mobile |
|---|---|---|---|---|
| Furniture & workspaces | 25 | 4.10 | 3.66 | 4% |
| Automotive | 23 | 3.90 | 3.63 | 9% |
| Fashion & accessories | 21 | 4.14 | 3.48 | 19% |
| Watches & jewelry | 20 | 4.01 | 4.00 | 0% |
| Home & garden | 18 | 3.95 | 3.28 | 17% |
| All industries | 140 | 4.01 | 3.55 | 11% |
Averages on our 1 to 5 scale. The last column is each industry's share of listings scoring under 3 on mobile; apps listed in two industries count in both.
Fashion shows the widest split: its performance average is among the highest of the five, yet its mobile average is the second-lowest. The weakness is concentrated in the 6 sportswear and uniform designers we track, which average just 2.17 on mobile. At the time of writing, every fashion listing below 3 on mobile is one of them.
These are design tools more than pickers, with free-form canvases, logo uploads, names, numbers and pattern generators. On a phone, every extra panel competes with the garment for a few inches of screen. Nike By You and Rimowa show that personalization itself isn't the problem, since both score at the top on mobile.
Home and garden has a different problem: size. Garden rooms, pools, pergolas, paving, doors and windows are big products, often shown in an outdoor scene, and every square meter of that scene is geometry and texture a phone must hold in memory. Watches and jewelry sit at the other extreme, with one small object and a short list of metals and stones that fit a phone screen naturally.
Furniture is in better shape: few listings fall below 3 on mobile, but most sit mid-scale rather than at the top. Our furniture benchmark shows who leads, and how five industries use browser 3D maps the feature differences behind these numbers.
Which car configurators work on mobile?
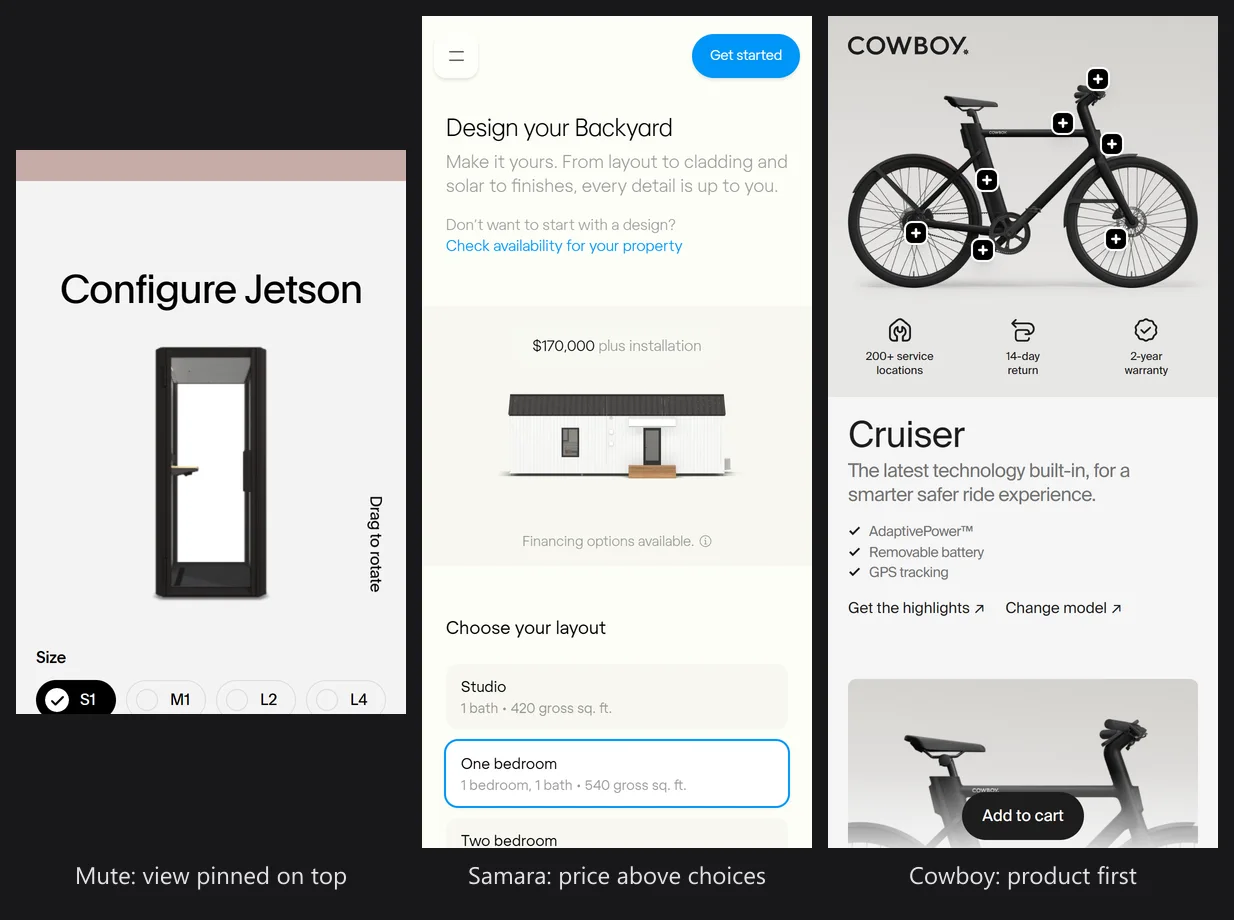
In automotive, configurators that send images to the phone beat those that render 3D in the browser. Listings with 2D delivery average 4.01 on mobile, against 3.27 for real-time 3D. Cowboy and Ferrari, the category's top mobile scorers at the time of writing, both deliver 2D images.
Images aren't always cheap to produce. Lamborghini renders its 2D views on demand from a live 3D scene in the cloud (Lamborghini), and BMW's EVE streams Unreal Engine over WebRTC with one cloud GPU per user (AWS Industries blog). The trade-offs are covered in how car configurators render in 2026.
Why does 3D break on phones?
Across the catalog, apps that render real-time 3D average 3.46 on mobile, while apps that deliver 2D images average 3.97. A phone can run WebGL well, but it has less memory and GPU headroom than a desktop, a denser screen and a thumb instead of a mouse. In our testing, most WebGL mobile performance problems trace back to five causes.
One pattern stands out. Asset strategy (4.09) and initial load feel (3.90) both average well above mobile, so many teams already compress their files and load reasonably fast. In our reading, file size explains only part of the gap, and layout and touch handling explain much of the rest.
Asset weight
Desktop builds often ship the same GLB and the same 4K textures to every device. On a cellular connection, every extra megabyte also pushes back the first frame.
JPEG and PNG files look small on disk, but the GPU decodes them to raw pixels: one 4096 × 4096 texture takes 64 MB of memory, plus a third more for mipmaps. A few materials with three maps each can fill a phone's budget before the buyer taps the first option.
Shader and pixel cost
Many phones run at a device pixel ratio of 3, so a canvas at native resolution draws nine pixels for every CSS pixel. Add real-time shadows, reflections and post-processing, and frame times climb fast. Phones also throttle their GPUs as they heat up, so a scene that starts smooth can stutter a few minutes in.
Option panels that cover the product
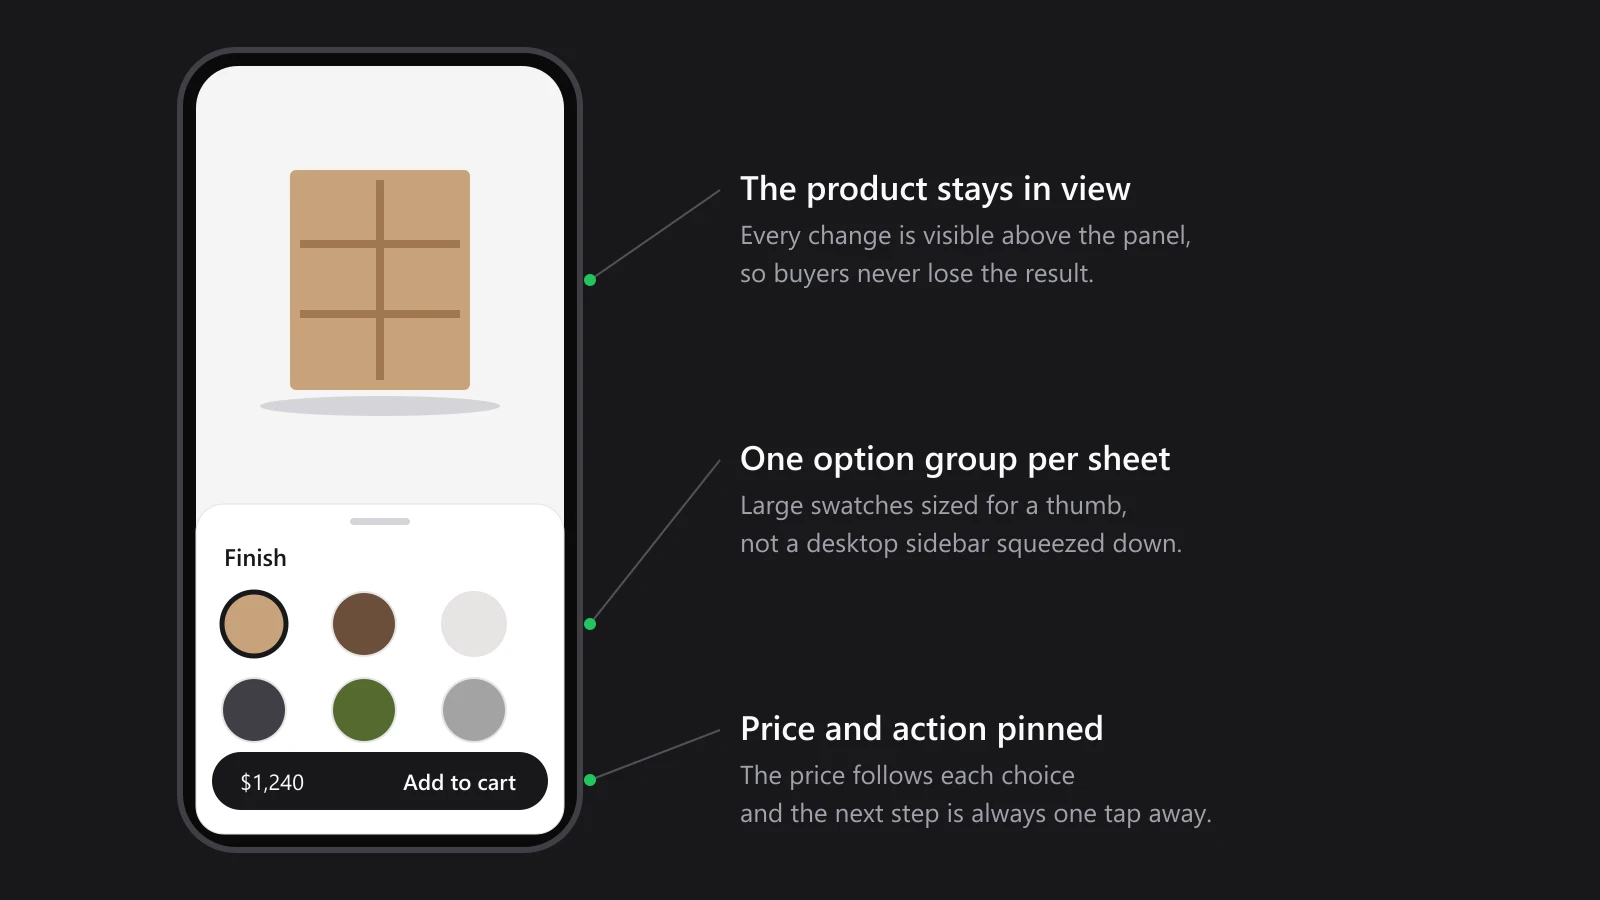
Desktop layouts put options in a sidebar beside a large canvas. On a phone, that sidebar often becomes a full-screen sheet, and the buyer taps a fabric without seeing the sofa change. What's a swatch worth if the buyer never sees it applied?
Gestures that fight the page
A one-finger drag can mean "rotate the model" or "scroll the page", and the browser can't tell which. Canvases that capture every touch trap the buyer, while canvases that capture none make rotation impossible. Pinch-to-zoom adds a second conflict with the browser's own zoom.
Memory limits and lost sessions
Phones give each tab far less memory than a desktop. When a scene uses too much, the browser can drop the WebGL context, or the system can kill the tab and reload it, and the buyer's half-finished configuration disappears.
On iPhones that reload can happen with no warning to the page (WebKit bug 300782). The same scene runs fine on a desktop GPU, which is how these failures survive sign-off.
How do the leaders fix mobile performance?
At the time of writing, 13 apps in our catalog score a full 5 on mobile, and 9 of them render real-time 3D in the browser. They span furniture, fashion, home and garden, automotive and jewelry, so strong 3D configurator performance on phones is clearly achievable.
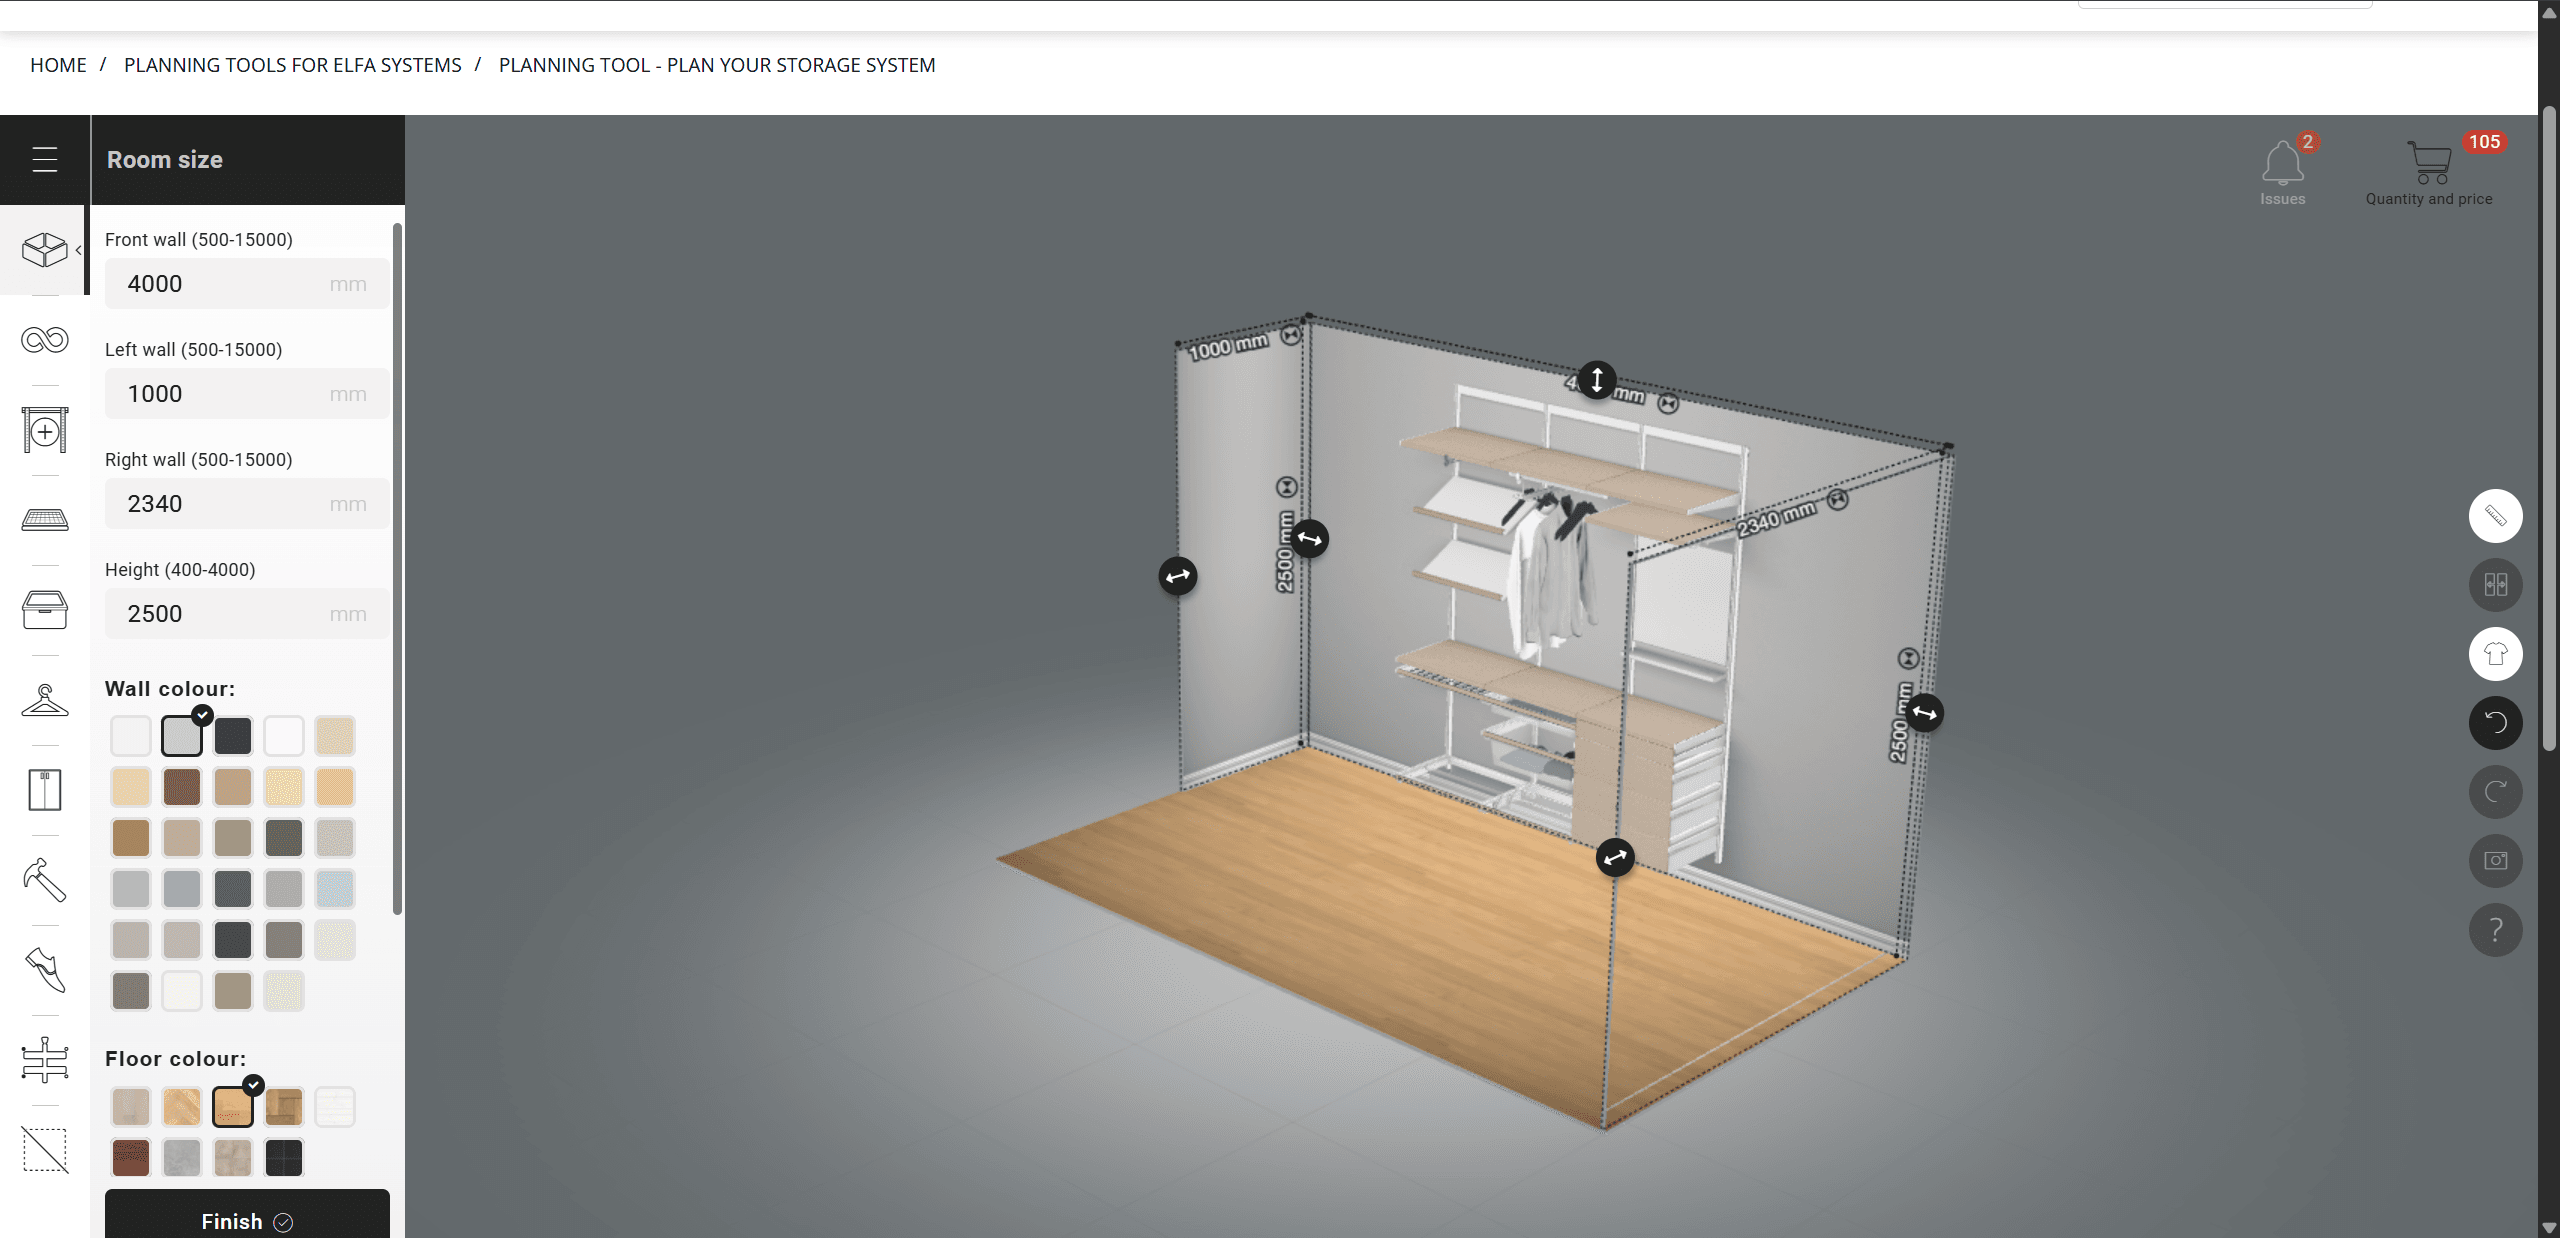
Elfa Storage System 3D Planning Tool
 Elfa
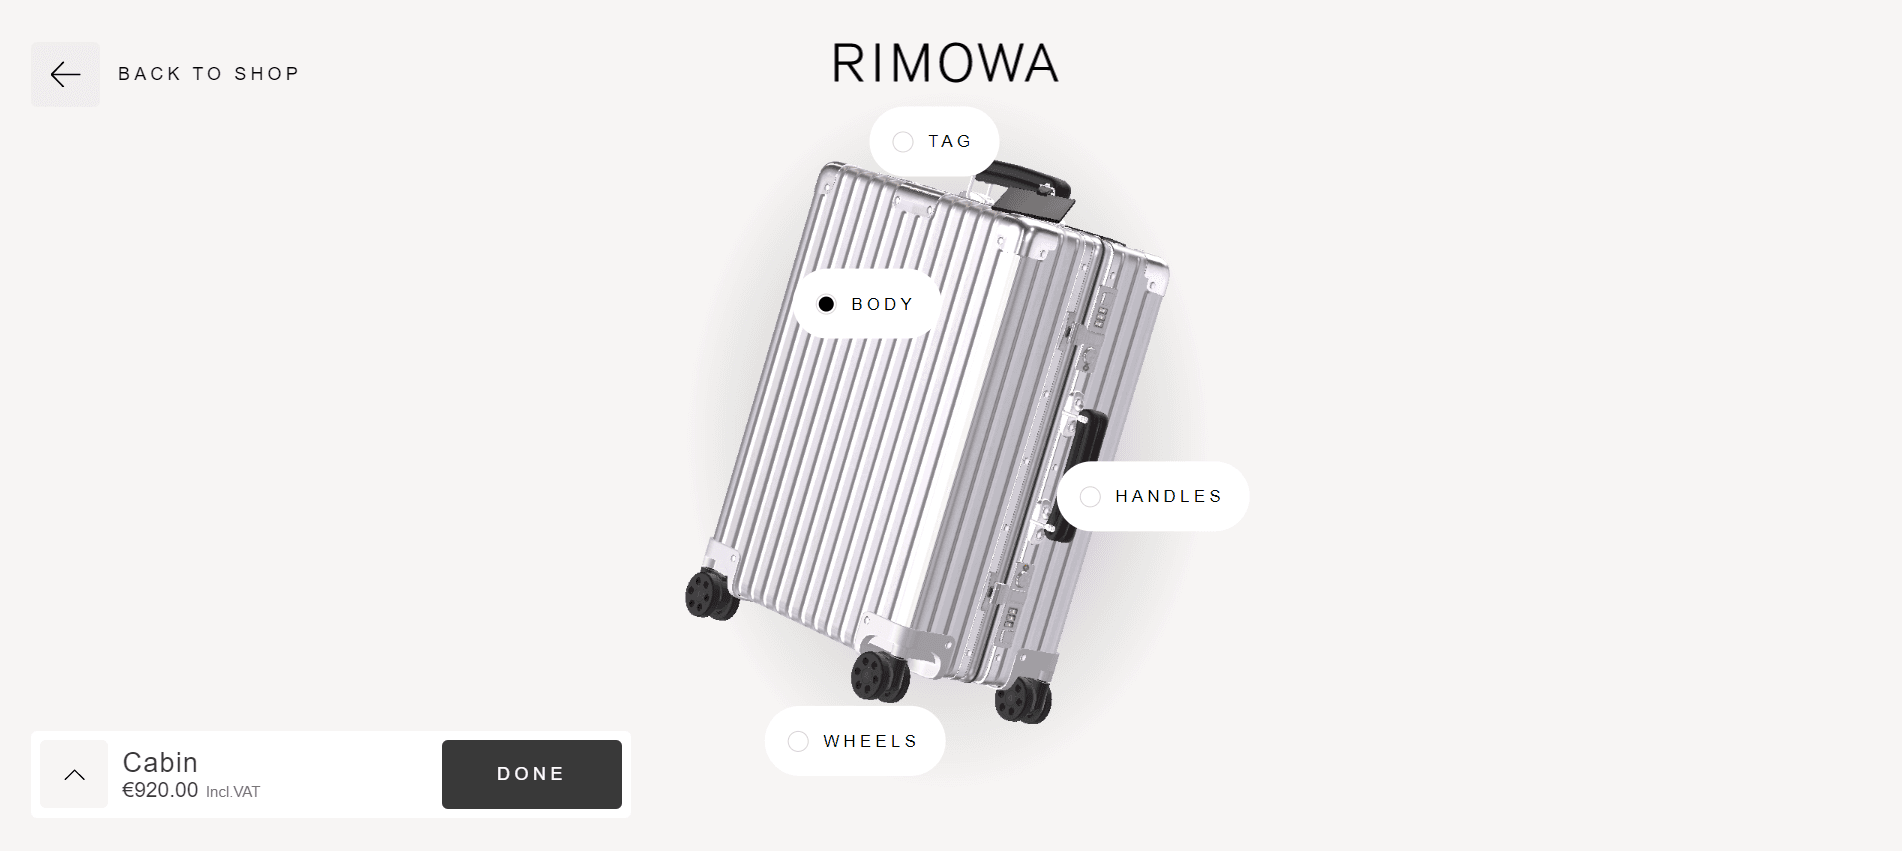
Rimowa Suitcase 3D Configurator
 Rimowa
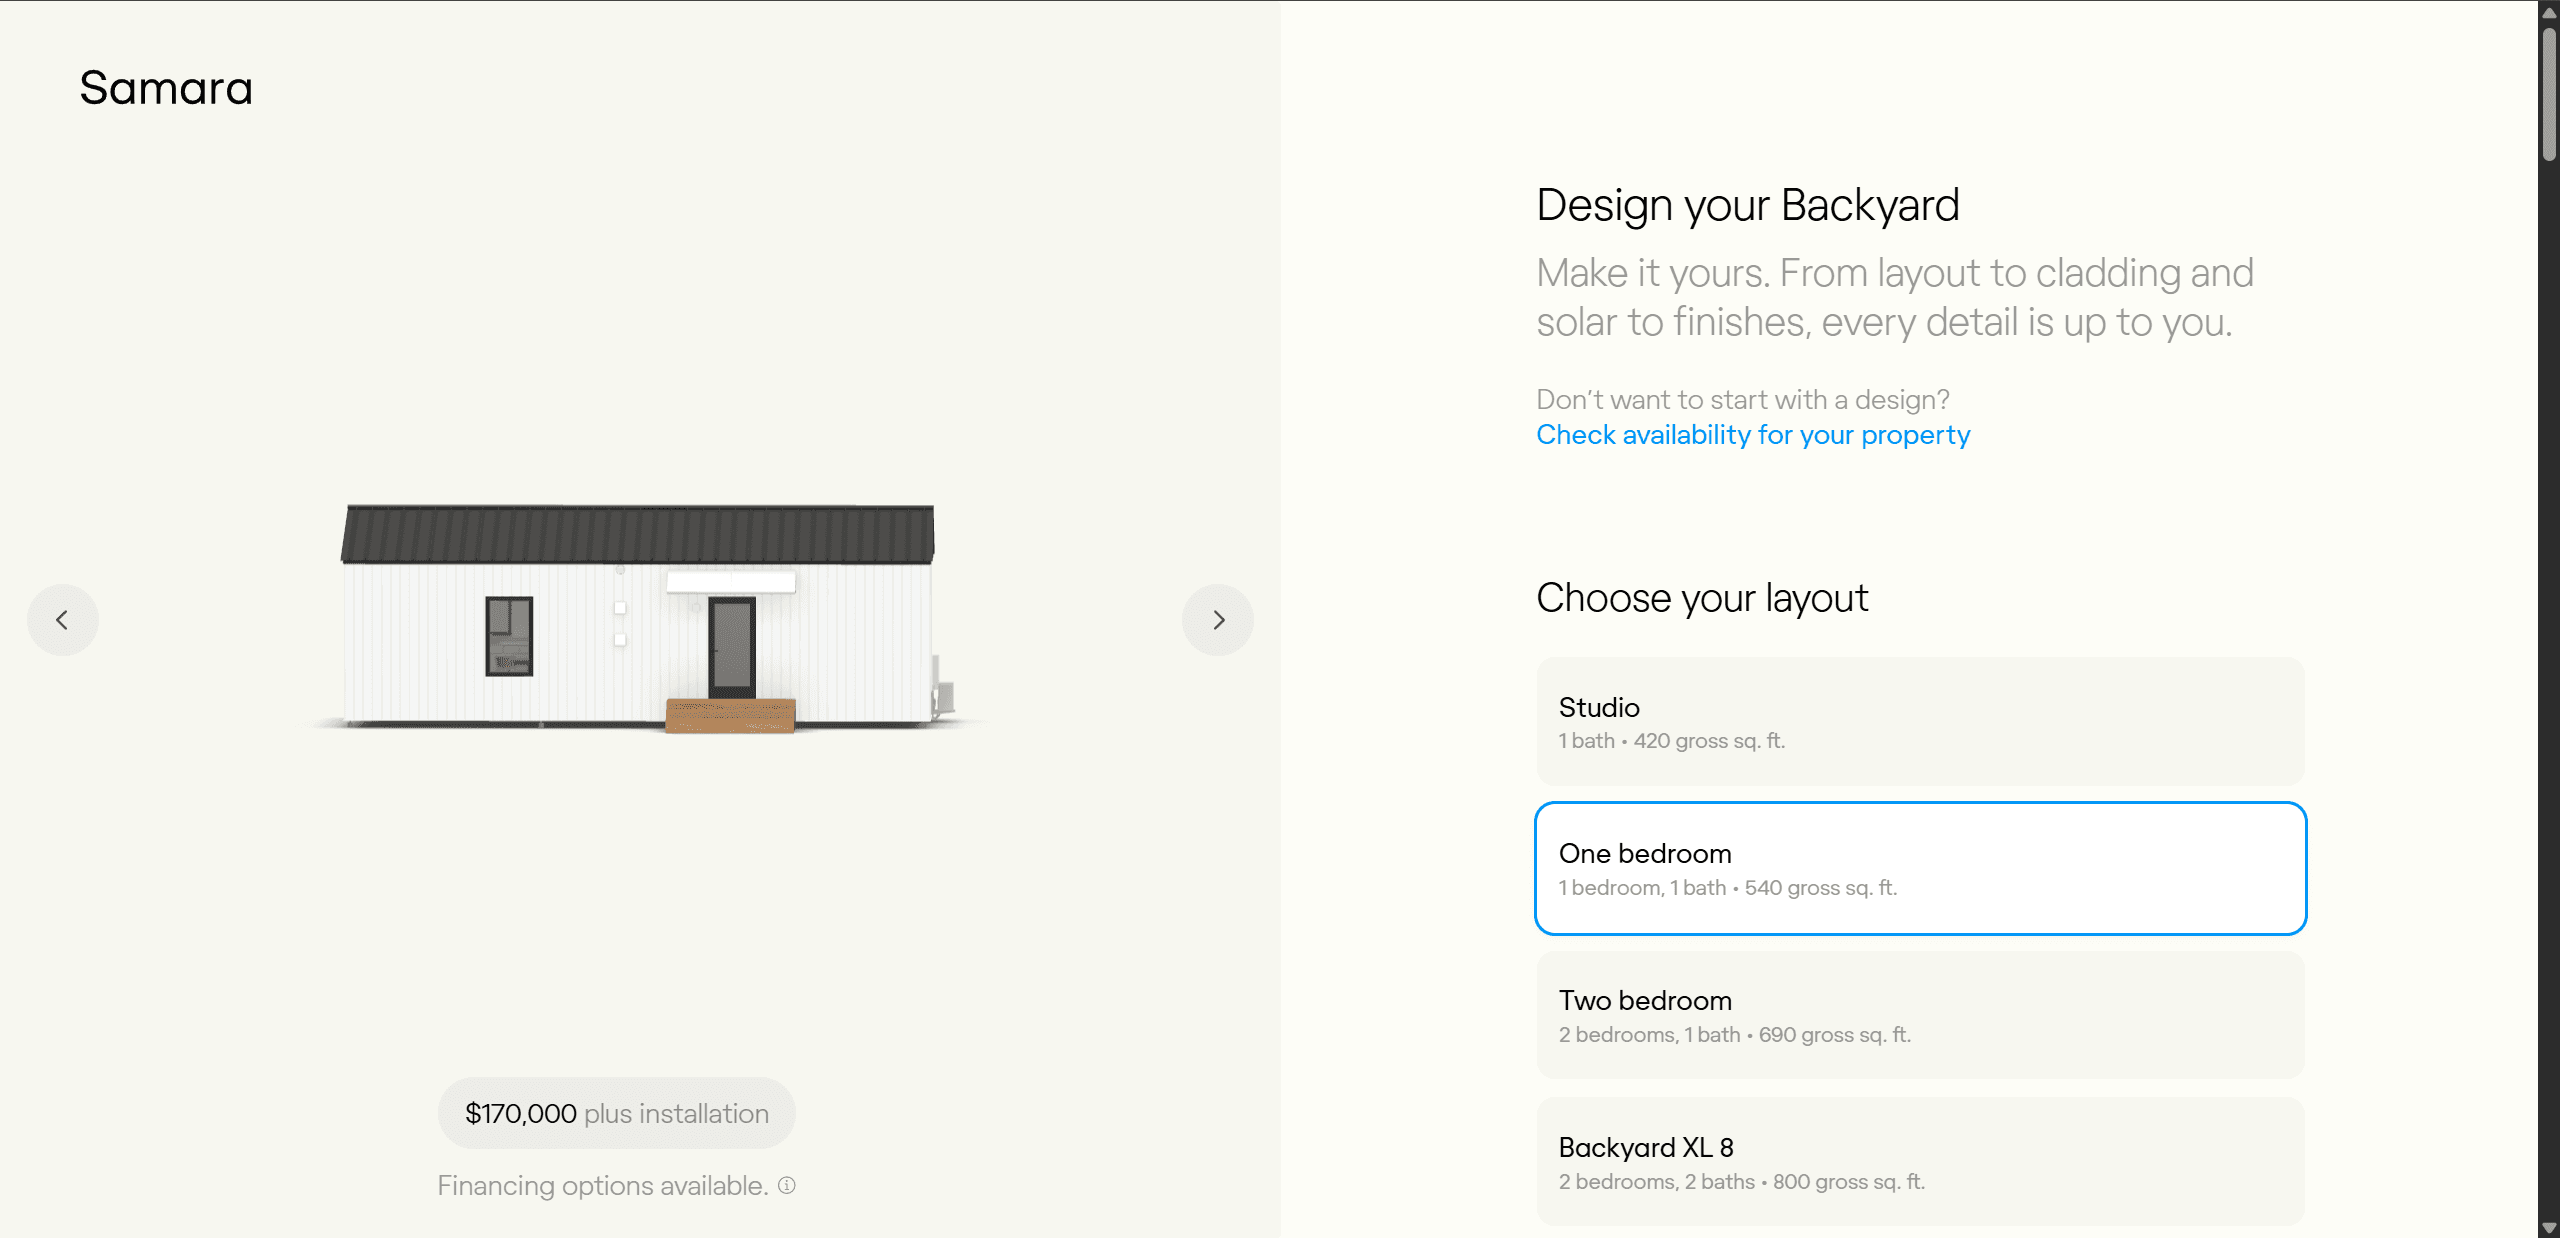
Samara Backyard Hybrid 3D&2D Configurator
Samara

Mute Workspace Cabins Simple 3D Configurator
 Mute
Elfa's storage planner shows that complexity isn't the excuse. It packs drag-and-drop planning, measurements and a priced parts list into a custom WebGL build by Animech, and still earns top marks on a phone. Rimowa handles colors and tag initials on Three.js and sits at the top of our scale for load feel and asset strategy.
Samara's backyard home configurator beats its category's weak average by splitting the work. The exterior is a live Three.js model, while kitchen and bedroom finishes appear as pre-rendered photos, which keeps the 3D scene light on a phone.
Mute's workspace cabins aren't among our fastest loaders, yet a clear layout earns full mobile marks. On a phone, the 3D view pins to the top of the screen once the options open, so every change stays in sight.
Compress geometry with Draco or Meshopt
Both are standard glTF extensions (KHR_draco_mesh_compression and EXT_meshopt_compression), and Three.js and Babylon.js decode both. As a rule of thumb, Draco squeezes geometry harder, while Meshopt decodes faster on weak CPUs. Run either through a pipeline tool such as gltf-transform, so every export is compressed rather than just the launch build.
Ship textures as KTX2
KTX2 with Basis Universal (the KHR_texture_basisu extension) stays compressed in GPU memory and transcodes to whatever the device supports, such as ASTC or ETC2. Depending on the format, that cuts texture memory to between a quarter and an eighth of raw RGBA. Serve 2K or 1K maps to phones, since 4K rarely shows extra detail on a six-inch screen.
Use LOD, cap the pixel ratio, render on demand
Level of detail (LOD) swaps in lighter meshes for small screens and distant views. Capping the device pixel ratio at 2 costs little visually and cuts a ratio-3 screen's pixel count by more than half: in Three.js that's renderer.setPixelRatio(Math.min(window.devicePixelRatio, 2)), and Babylon.js offers the same through its hardware scaling level. Redrawing only when something changes keeps the phone cooler and the frame rate steadier.
Set a first-frame budget
Speed has a measurable price on phones. A Deloitte study commissioned by Google across 37 brands found that a 0.1-second improvement in mobile site speed lifted retail conversions by 8.4% and average order value by 9.2% (Deloitte for Google, via web.dev, 2020). It measured whole-site speed rather than 3D, and Google paid for it, so read it as a directional, platform-sponsored result.
Turn that into a budget your builder can test: what the buyer sees first, the maximum download before that frame, and the phone and network it's measured on. Alternate materials, extra modules and environment detail can load after the buyer is already interacting.
Show a preview image, then load progressively
A pre-rendered image of the default configuration can appear almost at once, with live 3D swapping in when it's ready. A 2021 teardown of Lucid's configurator by an independent developer found it starts as a pre-rendered 2D spin, runs a bandwidth test of roughly 25 MB, then upgrades to streamed 3D and drops back after 60 seconds idle (skz.dev, 2021). That's third-party reverse engineering rather than a Lucid statement, but the same pattern works for WebGL builds.
After the first frame, fetch each material, module or accessory only when the buyer opens that option.
Put options in a bottom sheet
The layout that holds up best in our mobile testing is a bottom sheet: options slide up from the bottom and the product stays visible above them. Keep the sheet to roughly the lower 40% of the screen, show one option group at a time, and pin the price and main button. Mute's sticky 3D view is the other pattern that works: the view stays pinned at the top while options scroll underneath.
Make tap targets big and gestures explicit
Apple's guidelines ask for a hit area of at least 44 × 44 points (Apple), and Google's Material Design asks for 48 × 48 dp (Android), so swatches need that room for a thumb. Contain rotation to the canvas with the CSS touch-action property, leave page area outside it for scrolling, and add a reset-view button for buyers who spin the product upside down.
Use images where rotation isn't the decision
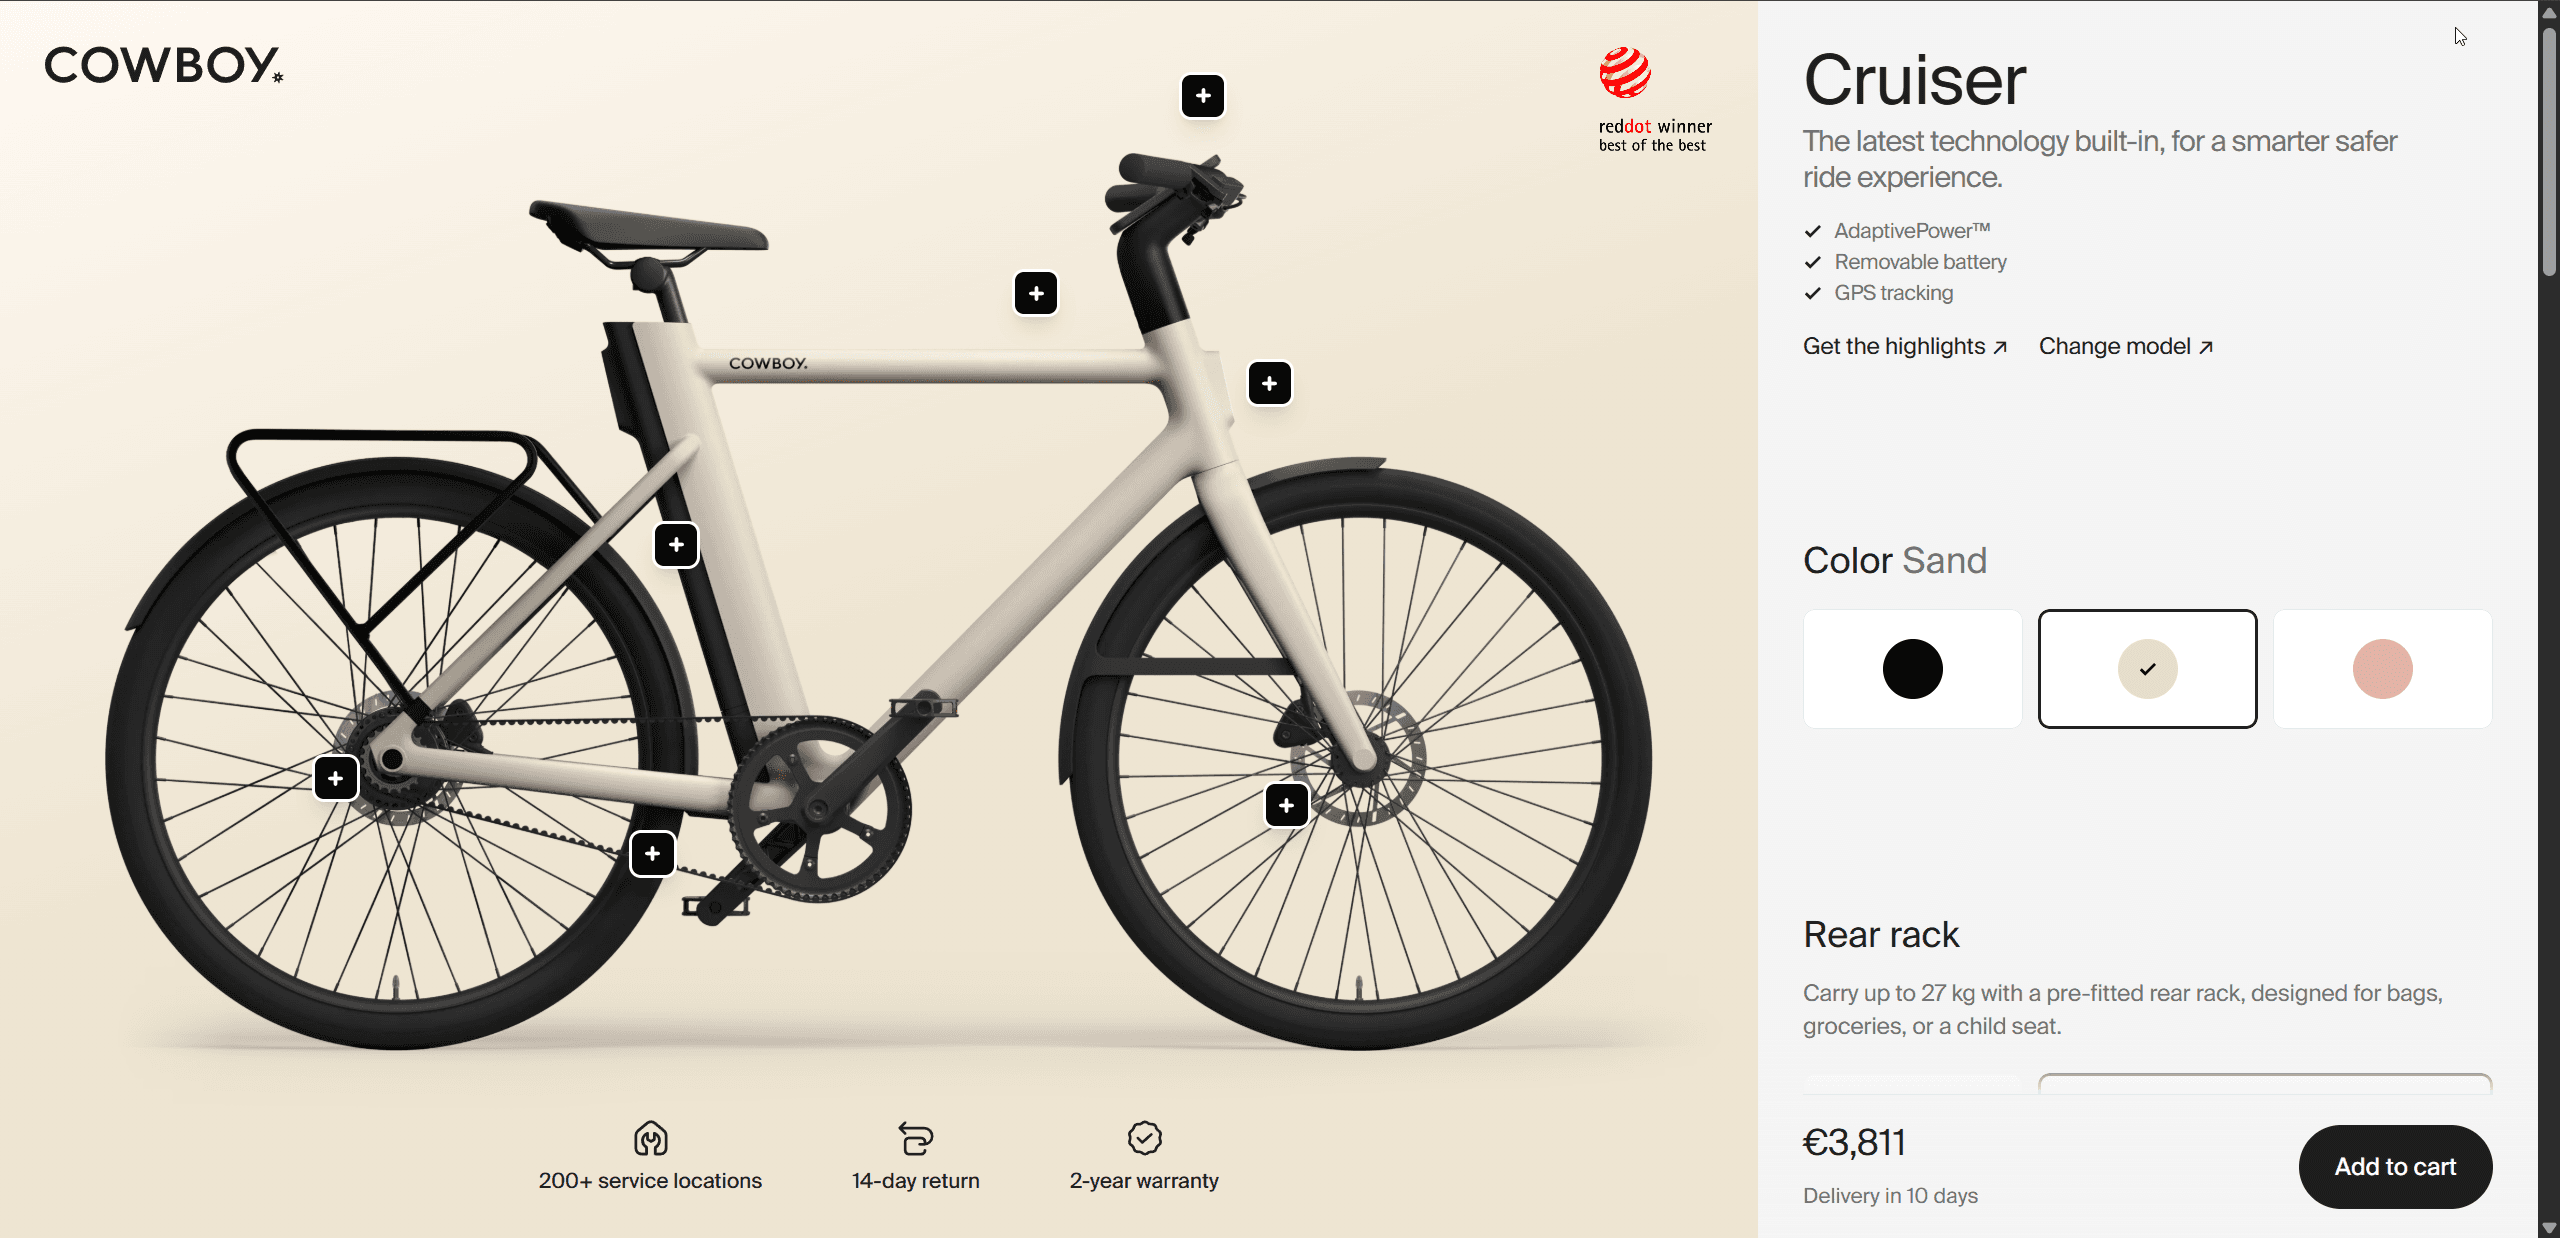

Cowboy's e-bike configurator sends 2D images rather than a 3D model and still scores at the top on mobile, because it loads fast and every option is one clear tap. If your buyers mainly pick colors and accessories, a well-made image configurator can beat a heavy 3D scene on a phone. A hybrid setup with 3D on capable devices and images as the fallback gets you both.
A 3D configurator mobile checklist for your brief
Our catalog currently holds 16 live configurators that score below 3 on mobile, so "works on mobile" is too vague for a contract. Write these lines into your brief and make sign-off depend on them.
- Test devices. A named mid-range Android phone, an iPhone two or three years old, and a throttled 4G profile, instead of a developer laptop.
- First-frame budget. A time limit and a download limit for the first useful view on those devices, written down so the build can fail it.
- Geometry. GLB with Draco or Meshopt compression, a triangle budget per product, and LOD meshes for large assemblies.
- Textures. KTX2 with Basis Universal, and 2K maximum on phones.
- Rendering. Pixel ratio capped at 2, rendering on demand, and heavy effects that switch off on weak GPUs.
- Loading order. A preview image first, then the base model, then options as the buyer opens them.
- Layout. Options in a bottom sheet, the product visible while choices change, and price and main button always on screen.
- Touch. Tap targets sized to platform guidelines, rotation contained to the canvas, and a reset-view button.
- Recovery. WebGL context loss handled, and the configuration saved in the URL so a reload or a shared link restores it.
- Fallback. A 2D or image mode for devices that can't run the scene smoothly.
- Proof. Screen recordings of the full flow on the named phones before sign-off, and real-user performance data from phones after launch.
These items move the estimate, so raise them before you collect quotes; what a 3D product configurator costs shows typical ranges. If you'd rather hand the list straight to a builder, you can request a build.
Get your configurator scored
Mobile averages 3.55 across our catalog, and one test on a real phone shows which side of that line your configurator sits on. Send us the URL, and within 48 hours we'll send the same 10-point review every listing gets, mobile included, plus the three changes that would lift your score most. It's free, and no account is needed.
Score my configurator, free
Send us the link. Within 48 hours you get the same 10-point review every listing gets, the three changes that would lift your score most, and where you stand against the leaders in your industry.